Rather than relying on someone else’s comparison, here’s how to build a chart tailored to your specific decision factors.
The reason a borrowed comparison chart tends to disappoint is that most of them compare products that are not competing for the same job. A short term charcoal kit, a long term alpha track detector, and a continuous electronic monitor all appear under the heading of radon testing, and they answer three genuinely different questions. Any chart that ranks them against each other on a single score is comparing a screening tool, an annual average measurement, and a trend instrument as though one could win. Building your own starts by deciding which question you are actually asking.
- Include certification, price, warranty, and use-specific technical specs (CFM, turnaround time) in your chart.
- Weight factors according to your specific situation (transaction deadline vs. ongoing monitoring).
- Verify certification and warranty details from primary sources, not just retailer summaries.
- A personalized comparison chart beats a generic one-size-fits-all ranking for your specific decision.
Key Columns to Include
Certification status (EPA-listed/NRPP-approved), price, warranty length and terms, and — for mitigation fans specifically — CFM rating and noise level. For test kits, include lab turnaround time and whether the kit is short-term or long-term.
Some columns matter regardless of what you are buying, and they are the ones most often left out. Whether the analysing laboratory participates in a recognised proficiency programme belongs near the front, because for any device that gets posted away, the laboratory is doing the measuring and its competence is the measurement’s competence. Whether the headline price includes laboratory analysis and return postage is the next most consequential, since a kit advertised cheaply with analysis charged separately can end up costing more than one that bundles it. For a passive kit, add the expiry date and the valid exposure window, since a kit deployed outside either is not a valid measurement.
For continuous monitors the useful columns are different. Record how long the device needs before its reading becomes statistically meaningful, since radon detection is a counting process and a small chamber needs longer to accumulate a usable sample. Record whether it stores and exports a readable history, because the value of a monitor lies in the trend rather than in the current number. Record the recalibration interval and its cost, the power arrangement, and whether the display gives you the short term and long term averages separately. For mitigation fans the decisive columns are the fan performance curve against your soil type, the rated static pressure and airflow, the wattage, the noise rating, the warranty term, and whether the housing is rated for exterior mounting.
Weighting What Matters Most to You
If you’re testing for a real estate transaction on a deadline, weight lab turnaround time and tamper-evidence heavily. If you’re planning ongoing personal monitoring, weight continuous monitor features and app integration instead.
Weighting only becomes tractable once you have named the decision the chart is meant to settle, and there are really only a few. If the question is whether this house has a problem at all, speed and cost dominate and almost nothing else matters, because you are buying a screening measurement you may never repeat. If the question is what the household is exposed to across a year, duration dominates, and a long term detector beats a more sophisticated short term device on the only axis that counts. If the question is transactional, then documentation, laboratory proficiency, and tamper resistance carry most of the weight, and convenience carries almost none.
A practical way to keep the weighting honest is to write down the decision at the top of the chart before adding any products, then assign weights, then fill in the rows. Doing it in that order stops the common failure, which is discovering an attractive feature partway through and quietly reweighting the chart around it. It also exposes the columns that feel important but do not actually differentiate anything: if every candidate scores the same on a column, that column has no influence on the outcome and can be dropped. What is left after that pruning is usually a much shorter chart that makes the decision obvious.
Sources for Filling In the Chart
Pull certification status directly from the NRPP/EPA listings rather than trusting a retailer’s product description alone, and cross-reference warranty terms against the manufacturer’s own published documentation, not just a summary on a retail page.
Source quality varies sharply by column, and it is worth matching each column to the kind of source that can actually answer it. Manufacturer specifications are reliable for physical facts such as dimensions, wattage, rated pressure and airflow, warranty terms, and stated exposure windows. State radon programmes and the EPA are the appropriate sources for action levels, testing protocols, and what closed house conditions require [1]. Laboratory proficiency participation should be confirmed with the laboratory or the relevant certification programme rather than inferred from marketing copy. National certification bodies for radon measurement and mitigation professionals maintain listings you can check a contractor’s credential against directly.
Customer reviews are worth reading but only for a narrow set of questions, and knowing which ones saves a lot of time. They are genuinely informative about durability over time, noise in real installations, whether laboratory turnaround matches the advertised figure, customer service responsiveness, and packaging and instruction clarity. They are close to worthless for accuracy, since almost no reviewer has a reference measurement to compare against, and a review reporting that a device gave a number the owner found surprising tells you about the house rather than the device. Reviews complaining that a monitor took a day to settle are usually describing correct behaviour rather than a fault.

A Chart That Actually Resolves a Decision
The most common structural mistake is building one large chart covering every radon product at once, which produces a table nobody can act on. Separating by decision produces something usable. A screening chart holds short term kits only, compared on total delivered cost including analysis, turnaround time, laboratory proficiency, and expiry window. A long term chart holds alpha track detectors compared on price, minimum and maximum deployment duration, and analysis inclusion. A monitoring chart holds continuous monitors compared on time to a stable reading, data export, recalibration requirements, and power. A mitigation chart holds fans compared on their performance curve against your soil, wattage, noise, and warranty.
Adding a do nothing row to each chart is a small habit that repeatedly earns its place. For a household that has already tested low in the lowest lived in level, under proper closed house conditions, with nothing about the building changed since, the honest comparison for a monitor purchase is against not buying one, and sometimes that row wins. Charts built without it have an implicit assumption that a purchase is going to happen, which quietly turns the exercise from a decision into a selection.
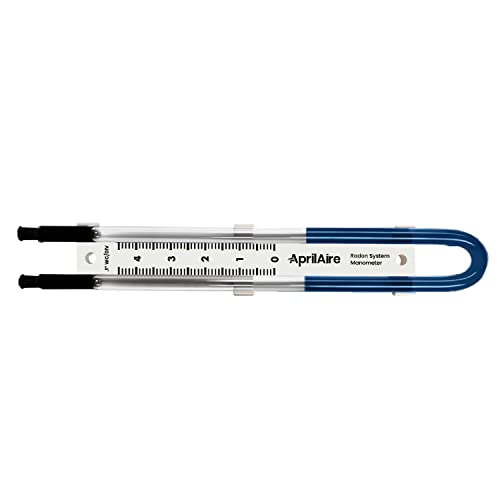
Two columns are worth adding at the end because they change conclusions more often than expected. The first is total cost across the realistic ownership period rather than purchase price, which for a fan means adding several years of continuous electricity consumption to the sticker price, and for a monitor means adding any recalibration cost. The second is what happens when the product fails, since radon equipment fails silently and the difference between a device that alerts you and one that simply stops is not visible in any specification comparison. That column is why a manometer, which has no electronics and no features to compare at all, tends to score higher than its price suggests.
FAQ
What’s the single most important column in a radon product comparison chart?
Certification status (EPA listing or NRPP approval) — this is the baseline accuracy signal that other factors like price and features shouldn’t override.
What is the single most important column in a radon product comparison?
For anything analysed by a laboratory, it is whether that laboratory participates in a recognised proficiency programme, because the device is a collection vessel and the lab performs the actual measurement. For a continuous monitor, it is the time the device needs before its reading becomes statistically stable, since that determines whether it can answer a short term question or only a long term one. For a mitigation fan, it is the match between the fan performance curve and the permeability of the soil under your slab, which matters far more than raw power.
Should I compare test kits and continuous monitors in the same chart?
It is usually clearer not to, because they answer different questions and a single ranking forces a false choice. A kit produces one integrated average over a defined period and, where the lab is proficiency tested, a documented result suitable for a transaction. A monitor produces an ongoing picture of how levels move day to day and season to season, which is what reveals whether a given result was typical. Many households end up using both at different stages, so comparing them against each other rarely resolves anything.
How do I check whether a laboratory or contractor is credentialed?
Ask directly for the certification number and check it against the issuing body’s own listing rather than accepting a logo on a website. National radon proficiency programmes maintain searchable listings of certified measurement and mitigation professionals, and many states run their own licensing or registration requirements on top of that, so it is worth checking your state radon programme as well. For laboratories, ask which proficiency programme they participate in and when they were last evaluated.
Verify specifications directly from manufacturer or certifying body sources rather than relying solely on retailer product descriptions.
References
- Find a Radon Test Kit or Measurement and Mitigation Professional. U.S. Environmental Protection Agency
These statements have not been evaluated by the Food and Drug Administration. This information is not intended to diagnose, treat, cure, or prevent any disease. Content is for informational purposes only and is not medical advice; consult a qualified healthcare provider before starting any supplement. As an Amazon Associate we earn from qualifying purchases.
